2023. 12. 10. 13:36ㆍ수능 해설
그림으로 설명하는 2024년도 수능해설
(그림과 해석을 보면 말이 필요없이 이해가 됩니다!)
♥ 궁금한 사항은 댓글 남겨주세요! ♥
<YouTube>
문제) 24. 다음 글의 제목으로 가장 적절한 것은? [3점]


정답 : ⑤ Overtourism: Not Simply a Matter of People and Places
<전체 지문>
The concept of overtourism rests on a particular assumption about people and places common in tourism studies and the social sciences in general.
Both are seen as clearly defined and demarcated.
People are framed as bounded social actors either playing the role of hosts or guests.
Places, in a similar way, are treated as stable containers with clear boundaries.
Hence, places can be full of tourists and thus suffer from overtourism.
But what does it mean for a place to be full of people?
Indeed, there are examples of particular attractions that have limited capacity and where there is actually no room for more visitors.
This is not least the case with some man-made constructions such as the Eiffel Tower.
However, with places such as cities, regions or even whole countries being promoted as destinations and described as victims of overtourism, things become more complex.
What is excessive or out of proportion is highly relative and might be more related to other aspects than physical capacity, such as natural degradation and economic leakages (not to mention politics and local power dynamics).
<전체 해석>
과잉 관광의 개념은 일반적으로 관광학과 사회과학에서 흔히 볼 수 있는 사람과 장소에 대한 특정한 가정에 기초를 두고 있다.
둘다 명확하게 정의되고 경계가 지어진 것으로 보여진다.
사람들은 주인 아니면 손님 역할을 하는 경계가 확실한 사회적 행위자로 구성된다.
그러므로, 장소는 관광객들로 가득찰 수 있고 따라서 과잉관광으로 고통받는다.
그러나, 사람들로 꽉차는 장소는 무엇을 의미할까?
정말로, 제한된 수용력을 가지고 있고 또 더 많은 방문객을 수용할 공간이 실제로 없는 특정한 관광명소의 예가 있다.
이것은 특히나 에펠탑과 같이 사람이 만든 몇몇의 건축물들과 같은 경우이다.
그러나, 목적지로 홍보되고 과잉관광의 희생지로 묘사되는 도시, 지역 또는 심지어 국가 전체와 같은 장소에서는 상황이 더 복잡해진다.
과도하거나 균형에 맞지 않는 것은 매우 상대적이고, 자연적 저하와 경제적 누출과 같은 물리적 수용력 이외의 다른 면들에 더 관계가 될 수도 있다(정치와 지역의 힘 역학은 말할 것도 없고).
문제) 25. 다음 도표의 내용과 일치하지 않는 것은?


정답 : ④
<전체 지문>
The above graph shows the percentages of the respondents in five countries who sometimes or often actively avoided news in 2017, 2019, and 2022.
① For each of the three years, Ireland showed the highest percentage of the respondents who sometimes or often actively avoided news, among the countries in the graph.
② In Germany, the percentage of the respondents who sometimes or often actively avoided news was less than 30% in each of the three years.
③ In Denmark, the percentage of the respondents who sometimes or often actively avoided news in 2019 was higher than that in 2017 but lower than that in 2022.
④ In Finland, the percentage of the respondents who sometimes or often actively avoided news in 2019 was lower than that in 2017, which was also true for Japan.
⑤ In Japan, the percentage of the respondents who sometimes or often actively avoided news did not exceed 15% in each of the three years.
<전체 해석>
위 그래프는 2017, 2019, 그리고 2022년에 때때로 또는 종종 뉴스를 적극적으로 피했었던 응답자들의 퍼센트를 보여준다.
각각의 3년동안 그래프의 나라들 중에서 아일랜드는 때때로 또는 종종 적극적으로 뉴스를 피한 응답자들의 가장 놓은 퍼센트를 보여주었다.
독일에서는 각각의 3년동안 때때로 또는 종종 뉴스를 적극적으로 피했었던 응답자들의 퍼센트가 각각의 3년동안 30%보다 낮았었다.
덴마크에서는 2019년에 때때로 또는 종종 뉴스를 적극적으로 피했었던 응답자들의 퍼센트가 2017년보다 더 높았었지만 2022년보다는 낮았었다.
핀란드에서는 2019년에 때때로 또는 종종 뉴스를 적극적으로 피했었던 응답자들의 퍼센트가 2017년보다 더 낮았었다, 일본의 경우에도 또한 사실이었다.
일본에서는 때때로 또는 종종 뉴스를 적극적으로 피했었던 응답자들의 퍼센트가 각각의 3년동안 15%를 초과하지 않았었다.
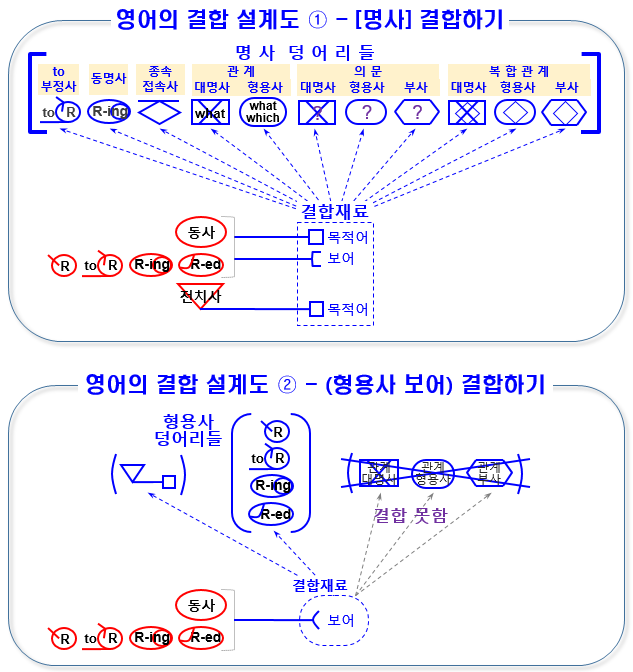
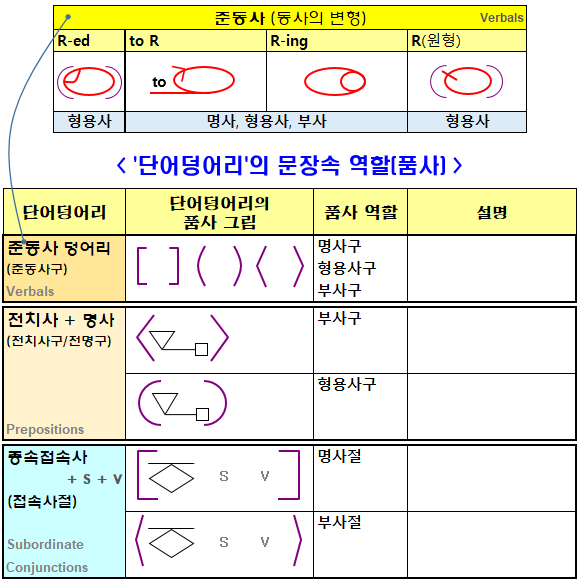
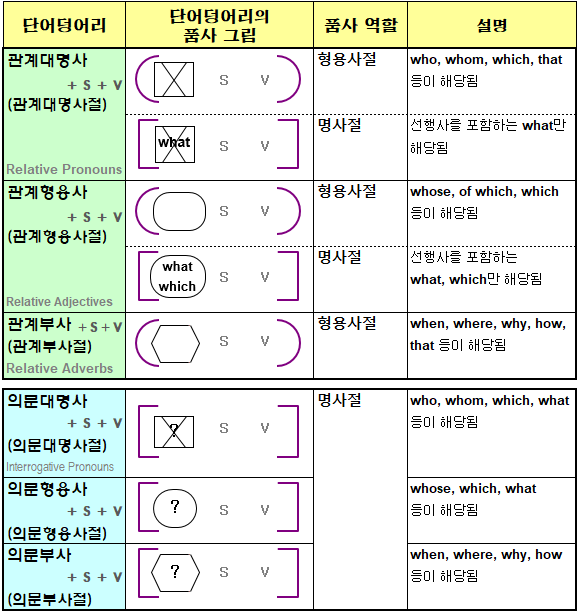
영어의 설계 원리를 그림 몇장으로 한방에 이해해 봅시다!


'수능 해설' 카테고리의 다른 글
| 2024년도 수능 해설_영어영역 22번~23번 (0) | 2023.12.10 |
|---|---|
| 2024년도 수능 해설_영어영역 20번~21번 (0) | 2023.11.21 |
| 2024년도 수능 해설_영어영역 18번~19번 (0) | 2023.11.21 |
| [23수능 해설] 18번_03. I happened to read an article (to부정사, 동명사) (0) | 2022.12.13 |
| [23수능 해설] 18번_02. I have been a bird-watcher (등위접속사) (1) | 2022.12.04 |